Micro-CT scanning for verification of microcracks in paintings
Microcracks in paintings are a well-known phenomenon, according to previous blog posts from 9th of June and 9th of November 2021.
The microcracks have been created in the computer-generated model (see previous blog post) and detailed documentation can help verify the modeling results.
Some microcracks are visible in the top layer of the painting, and some are only visible in the lower layers and in the ground. To study cracks in paintings, conservators have until now primarily used High Resolution Macro Photography for cracks in the surface, Near Infra-red induced reflected Imaging (IRR) for cracks in the top of the ground layer and conventional X-ray Radiographs (XRR) for a summation of all layers.
Micro-CT scanning is a new technology, which is not commonly used in conservation. As known from the medical scanners, CT is well suited to illustrate underlying structures. A micro-CT scanner is about 500 times as good in spatial resolution as a modern medical CT scanner. The only limitation is the size of the items to be scanned. With the use of micro-CT, new possibilities open for visualization of how the cracks are spreading in several planes, which is not possible with the other methods mentioned.
As a part of the Collection Care project, the Royal Danish Academy has collaborated with DANFIX 3D Imaging Center, Technical University of Denmark (DTU), which is in possession of three micro-CT scanners. By this collaboration, we have examined a lot of different canvasses in the micro-CT scanner Zeiss Xradia Versa 410 (Fig 1).

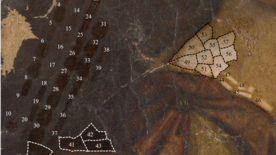
The samples have been subjected to a variety of physical tests, conservation treatment and artificial aging to provoke degradation and cracking. In some of the samples we have discovered a clear tendency to develop a pattern of parallel microcracks marked with orange arrows (Fig 2b).
The orange squares on Fig 2a-c marks the various Field of Views (FOV) which the sample have been scanned by. Fig 2b shows a FOV at 3600x3600µm and Fig 2c shows a FOV at 1440x1440µm.

By investigating the samples with micro-CT, we have managed to see even more cracks, and not least, it has been possible to follow their course so that it is possible to see their origins. By using a various number of parameter settings and reconstruction algorithms it is possible to illustrate this.
In Fig 3 a superficial crack 1 is shown. Note that the crack (orange arrow) on the scan extends significantly further than is possible to recognize in the macro photo on the left. The crack is measured to be 352 µm.

Fig 4 and 5 also shows a deeper-lying crack 2 (green), which is measured to be 202 µm. The crack 1 (from Fig 3) is shown in red. Note that the green crack 2 lies parallel to the red but is significantly deeper in the ground.
The cracks are parallel and follows the spinning angle of the thread. In this case in the warp direction. This is also illustrated on the animation.


The whole idea of using Micro-CT is quite unique because it can be related to the computer animated degradation model that we have presented in a previous blog post. The use of Micro CT can thus help to support and verify the phenomena we are trying to predict in the model.


